TPC Readout with CRU

We use the O2 roc library to communicate with the CRU, and we do direct writes to the HDLC and SCA core to read 13 SCA ADC channels each 10 seconds.

I guess only ReadoutCard library is important here? This is v0.8.8-1, but just in case – Common-O2 is v1.2.3-6.

We will try to reproduce it by doing a looping writing/reading to the SCA on the CRU using your Python ROC class overnight.

Hello,
yes please share with us the list of commands you execute, so we can try to reproduce it in the lab.
Thx

Hi,
I now started a script that will do a GPIO write every 0.5 seconds and then exit when the expected execution time goes above the normal time it should take by a factor 10.

It is at the end of this post, since this site only let me upload images. It requires to source load_common.sh from cru-sw, and it takes a logfile as command line argument:

./stress_cru_reg_access.py ~/logs/cru/register_access_stress.log

The log contains the same that I print to stdout, which is the time it started, and eventually when it was either cancelled or it exited because the execution time started to be too long, as well as how many iterations it did.

PS: You might need to change the PCI ID in the part where the SCA class is initiliazed.

#!/usr/bin/env python2
import time
import sys
import os
import datetime as dt
#from contextlib import redirect_stdout # requires python>=3.4

import SCA
from SCA import Sca

class SlowdownError(Exception):
	def __init__(self, value):
		self.value = value
	def __str__(self):
		return repr(self.value)

# From: https://codereview.stackexchange.com/questions/25417/is-there-a-better-way-to-make-a-function-silent-on-need
class NoStdStreams(object):
	def __init__(self,stdout = None, stderr = None):
		self.devnull = open(os.devnull,'w')
		self._stdout = stdout or self.devnull or sys.stdout
		self._stderr = stderr or self.devnull or sys.stderr

	def __enter__(self):
		self.old_stdout, self.old_stderr = sys.stdout, sys.stderr
		self.old_stdout.flush(); self.old_stderr.flush()
		sys.stdout, sys.stderr = self._stdout, self._stderr

	def __exit__(self, exc_type, exc_value, traceback):
		self._stdout.flush(); self._stderr.flush()
		sys.stdout = self.old_stdout
		sys.stderr = self.old_stderr
		self.devnull.close()

# Tried to make it sexy, but let's just use file.write() shit
if (len(sys.argv) > 1):
	print("Logging to file "+str(sys.argv[1]))
	logFile = open(str(sys.argv[1]), 'w')
else:
	print("Please specify log file, exiting...")
	exit()

#with redirect_stdout(logFile):

print("{}: Starting CRU register write stress test".format(dt.datetime.now()))
logFile.write("{}: Starting CRU register write stress test\n".format(dt.datetime.now()))

with NoStdStreams():
	sca = Sca("04:00.0", 2, 0, 'CRU')
	sca.displayAdd()
	sca.init()
	sca.reset()
	sca.gpioEn()

try:
	numIterations = 0
	while(True):
		start_time = time.time()
		with NoStdStreams(): # Silence output from Sca class
			sca.gpioWr(0x20800140)
		numIterations += 1
		elapsed_time = time.time()-start_time
		if(elapsed_time>0.002): # usually takes around 0.2 ms, so let's use a factor of 10
			raise SlowdownError(elapsed_time)
#		print("GPIO Write took: {} s".format(elapsed_time))
		time.sleep(0.5)
except (KeyboardInterrupt) as e:
	print( '{}: Exited because of keyboard interrupt...'.format(dt.datetime.now()) )
	print( '    Did {} iterations of gpioWr()'.format(numIterations) )
	logFile.write('{}: Exited because of keyboard interrupt...\n'.format(dt.datetime.now()))
	logFile.write( '    Did {} iterations of gpioWr()\n'.format(numIterations) )
	exit()
except SlowdownError as e:
	print( '{}: Exited because execution time was {} s'.format(dt.datetime.now(), e) )
	print( '    Did {} iterations of gpioWr()'.format(numIterations) )
	logFile.write( '{}: Exited because execution time was {} s\n'.format(dt.datetime.now(), e) )
	logFile.write( '    Did {} iterations of gpioWr()\n'.format(numIterations) )
	exit()

Ok … I am on it.
Thx

Ok, I couldn’t test your script as I don’t have a vldb dongle to bring up the FEC link.
In the mean time I am doing SWT tests (another slow control feature in the CRU) using an optical loopback.

Every SWT WR and RD consists of 4 BAR register accesses, and I can check what I sent out.

I am checking the data I receive and the time it takes to execute.
If it is bigger than 10 times it stops.

In this way I should be able to test only the driver and the CRU excluding external components.

I will keep you posted.

Ciao,
so here my results.
Indeed the time to execute commands increases a bit after some time, however I collected the time it took to execute the sequence of commands 100’000 times.
In this case the time doesn’t increase much, it has a min of 1s to a max of 1.6 s
I collected 40K samples

Hi Pippo,

Lars also did some test and he can see quite some increase. He will post the results soon. In your plot, why is the density increasing at the end of the plot?

T.

O.k. I think the change in “density” at the end is just that all the points which usually overlay on the “1” line got raised up. So there is an increase in the command execution time. If you would calculate the average over a sliding window, this average execution time would rise. Which, in my opinion, should never happen when you access memory mapped PCI-E registers.

Hi Pippo,
My script stopped once the execution time went from around 0.2 ms to 10 ms.
Granted, I should have not stopped it and rather logged the execution time like you did, but we now see the same kind of slowdown when doing more than a single operation, where the time is again spent in the PCI DMA driver.
The single write now takes .25-0.3 ms, so around the same increase that you see, around ~50-60%.

I will do a bit more investigations on our setup.

Ciao, it would be interesting to understand why it went up only at the end.
Take into account this. The time was displayed after 100’000 SWT commands execution and each execution was 8 register accesses (most of them writing).
I am not sure if the O.S. could have an effect on this.

Anyway the execution time didn’t increase systematically, it always remained lower than a certain threshold.

Kostas has access to this thread, he will check it.

Thx

Hi,

Another update:
So our software wraps around AliceO2::roc library to do direct register accesses to the CRU and the HDLC core.
As an example, I did a read of the GPIO DIN register of the SCA, i.e. SCA command GPIO_R_DATAIN, which consists of four register accesses indicated in bold:
HdlcCernMe::sendFrame_(HdlcEcFramePayload& r) const
{
uint32_t wdata, wcmd;
assembleRegisters(r, wcmd, wdata);
bar_.write(base_addr_ + REG_WR_DATA, wdata);
bar_.write(base_addr_ + REG_WR_CMD, wcmd);
startFrameTx();
}

uint32_t
HdlcCernMe::getFrame(HdlcEcFramePayload& r) const
{
disassembleRegisters(r, bar_.read(base_addr_ + REG_RD_CMD), bar_.read(base_addr_ + REG_RD_DATA));
return r.error;
}

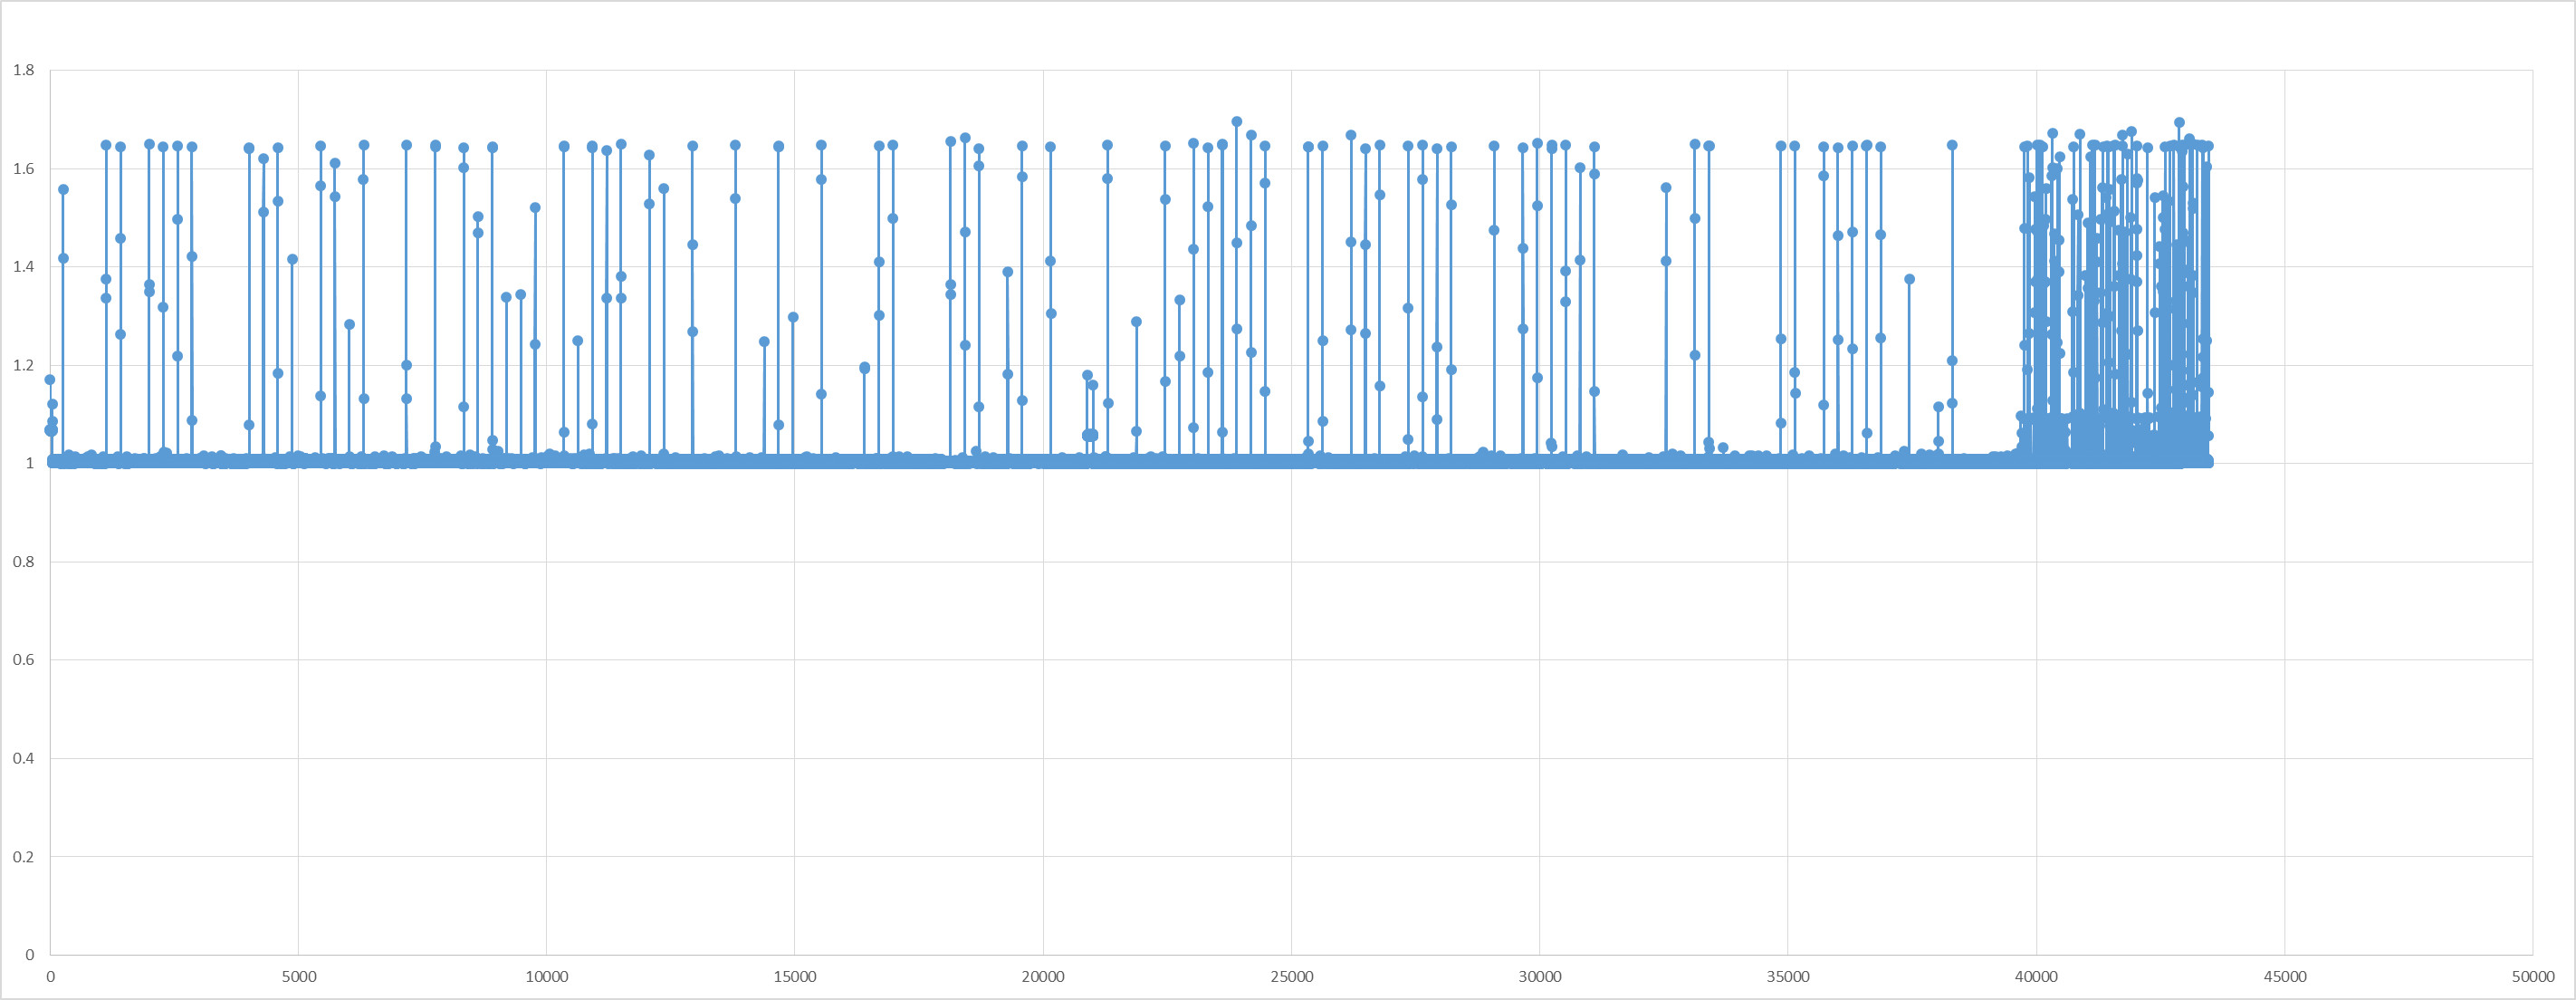
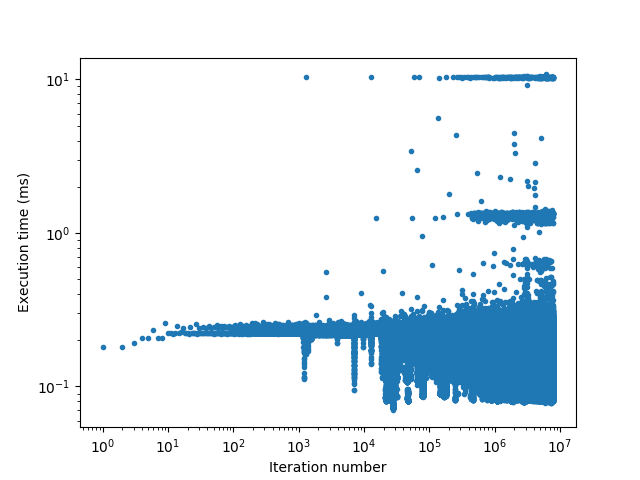
Now, after the system starts to be slow, we see these four accesses takes around 125 ms each.

-bash-4.2$ perf trace --duration 10.0 tsca --id 04:00.0 -m 0x4 --gpio-din 
42.812 (127.143 ms): tsca/41016 write(fd: 3</sys/bus/pci/drivers/uio_pci_dma/new_id>, buf: 0x7f120a3d3000, count: 9) = 9
189.331 (125.418 ms): tsca/41016 write(fd: 3</sys/bus/pci/drivers/uio_pci_dma/new_id>, buf: 0x7f120a3d3000, count: 9) = 9
379.624 (125.411 ms): tsca/41016 write(fd: 3</sys/bus/pci/drivers/uio_pci_dma/new_id>, buf: 0x7f120a3d3000, count: 9) = 9
524.309 (126.205 ms): tsca/41016 write(fd: 3</sys/bus/pci/drivers/uio_pci_dma/new_id>, buf: 0x7f120a3d3000, count: 9) = 9
[gpio-din] 0x20a02540

I then reinitialized the DMA driver, and it drops very substantially to ~0.3 ms:

-bash-4.2$ (perf trace tsca --id 04:00.0 -m 0x4 --gpio-din) > test.log 2>&1
-bash-4.2$ cat test.log | grep write
    44.745 ( 0.377 ms): tsca/20326 write(fd: 3, buf: 0x7f24122c6000, count: 9                            ) = 9
    66.412 ( 0.278 ms): tsca/20326 write(fd: 3, buf: 0x7f24122c6000, count: 9                            ) = 9
   133.096 ( 0.283 ms): tsca/20326 write(fd: 3, buf: 0x7f24122c6000, count: 9                            ) = 9
   154.833 ( 0.284 ms): tsca/20326 write(fd: 3, buf: 0x7f24122c6000, count: 9                            ) = 9

Ok.
We will try to have a better understanding.
Are you worried that the configuration time of your electronics will take too much time?

We will have 10 FEC connected to each CRU, how many SCA commands do you plan to do to configure the FEC?
And how many commands do you plan to execute to monitor it?

As I said in my tests to execute 100’000 times (7 BAR WR and 5 BAR RD) it tooks max ~1.6 seconds.
That makes a total of 1M bar accesses using python, that should be slower than a C program.
(of course in this case I excluded the response time of the FEE)

Can we make an estimation on the list of commands you want to execute ?

Thx

Hi Pippo,

sure we can make an estimate. However, it is not the time i am worried about. It is about the fact that a register access (an access to a memory mapped region) increases in time. That should never(!!!) happen and is a clear sign that something is not working as it should. While this might not be an issue at the moment, other side-effects might pop up in the future and they might be worst. It’s like building a house. It’s always good to get your foundation right before you build upon that.

Cheers,
Torsten

Hello everyone,

To test the bar accesses for the slow control interface on the CRU I wrote a tool to run the following scenario. I configured the card to run in loopback mode through the FPGA SerDes and started running SWT write and reads. SWT is a configuration protocol that allows to send a custom pattern over GBT data field. Every sent and received value were compared to ensure the validity of the transactions, with different data for every write. I got time readings every million SWT operations = 12million bar accesses (read + write). I ran the tool for 48 hours straight to see if we come upon any slowdown in bar accesses or validation errors. As you can see from the plot that’s following, nothing weird is being observed.

Cheers,
Kostas

Hi,

Bringing this up again. Here is a plot I made some months ago where I do constantly SCA GPIO accesses, and in the beginning it has more or less constant execution time, but as time goes on, the execution times goes all over the place, and this is when CRU access starts to slow down.

gpioWr

I was using the classes in cru-sw for GPIO access.
Our hypothesis is that it is either related to the SCA core, or the O2 ROC library.

Ciao Lars,
thx we will check that again.
Currently we are a bit busy, but we’ll come back to this issue quite soon and let you know.

Cheers