namalik
August 19, 2022, 12:59pm
1
Dear expert, I am trying to change the label of a 2d histo’s using
auto xax = mLayers[iLayer]->GetXaxis();
    xax->SetNdivisions(-5);
        xax->CenterLabels();
     xax->SetTickLength(0);
     for(Int_t i =0; i<5;i++)  xax->ChangeLabel(i+1,-1,-1,-1,-1,-1,Form("%i",i));

    auto yax = mLayers[iLayer]->GetYaxis();
    yax->SetNdivisions(-18);
    yax->CenterLabels();
    for (int iSec = 0; iSec < 18; ++iSec)  yax->ChangeLabel(iSec+1,-1,-1,-1,-1,-1,Form("%i",iSec));
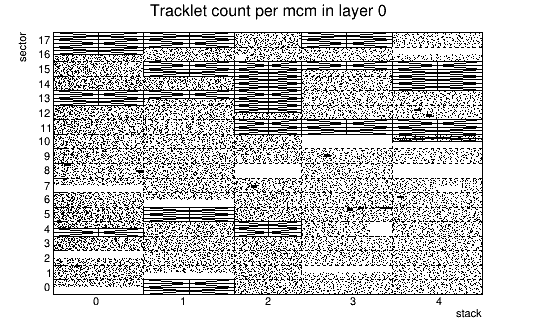
plot in local root file is good .
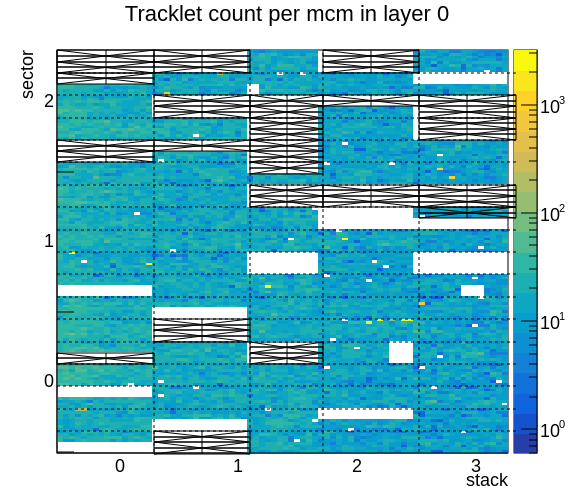
https://qcg-test.cern.ch/?page=objectView&objectName=qc/TRD/MO/TrackletsTask/TrackletsPerLayer/layer0 look at the label it able to draw label for three-tick only.
Any suggestion?
graduta
August 19, 2022, 3:03pm
2
Hi @namalik ,
Thank you for the question!
The generated plot by QCG is the one intented by the task generating the ROOT Object. If you take a closer look at the object stored in CCDB: http://ccdb-test.cern.ch:8080/latest/qc/TRD/MO/TrackletsTask/TrackletsPerLayer/layer0 , you will see that there are 2 parameters stored in the database: drawOptions - COLZ and displayHints - logz
These parameters are generated through QC tasks (more info: QualityControl/Advanced.md at master · AliceO2Group/QualityControl · GitHub )
If you would like to ignore these parameters, you will need to:
Create a layout
Add the object to your layout
Edit layout and select object and select option Ignore defaults
Save the layout
I created an example layout with comparisons for you: https://qcg-test.cern.ch/?page=layoutShow&layoutId=62ffa5d432332505759f139e
Please let me know if you have further questions!
Have a nice weekend,
namalik
August 24, 2022, 11:55am
3
@graduta