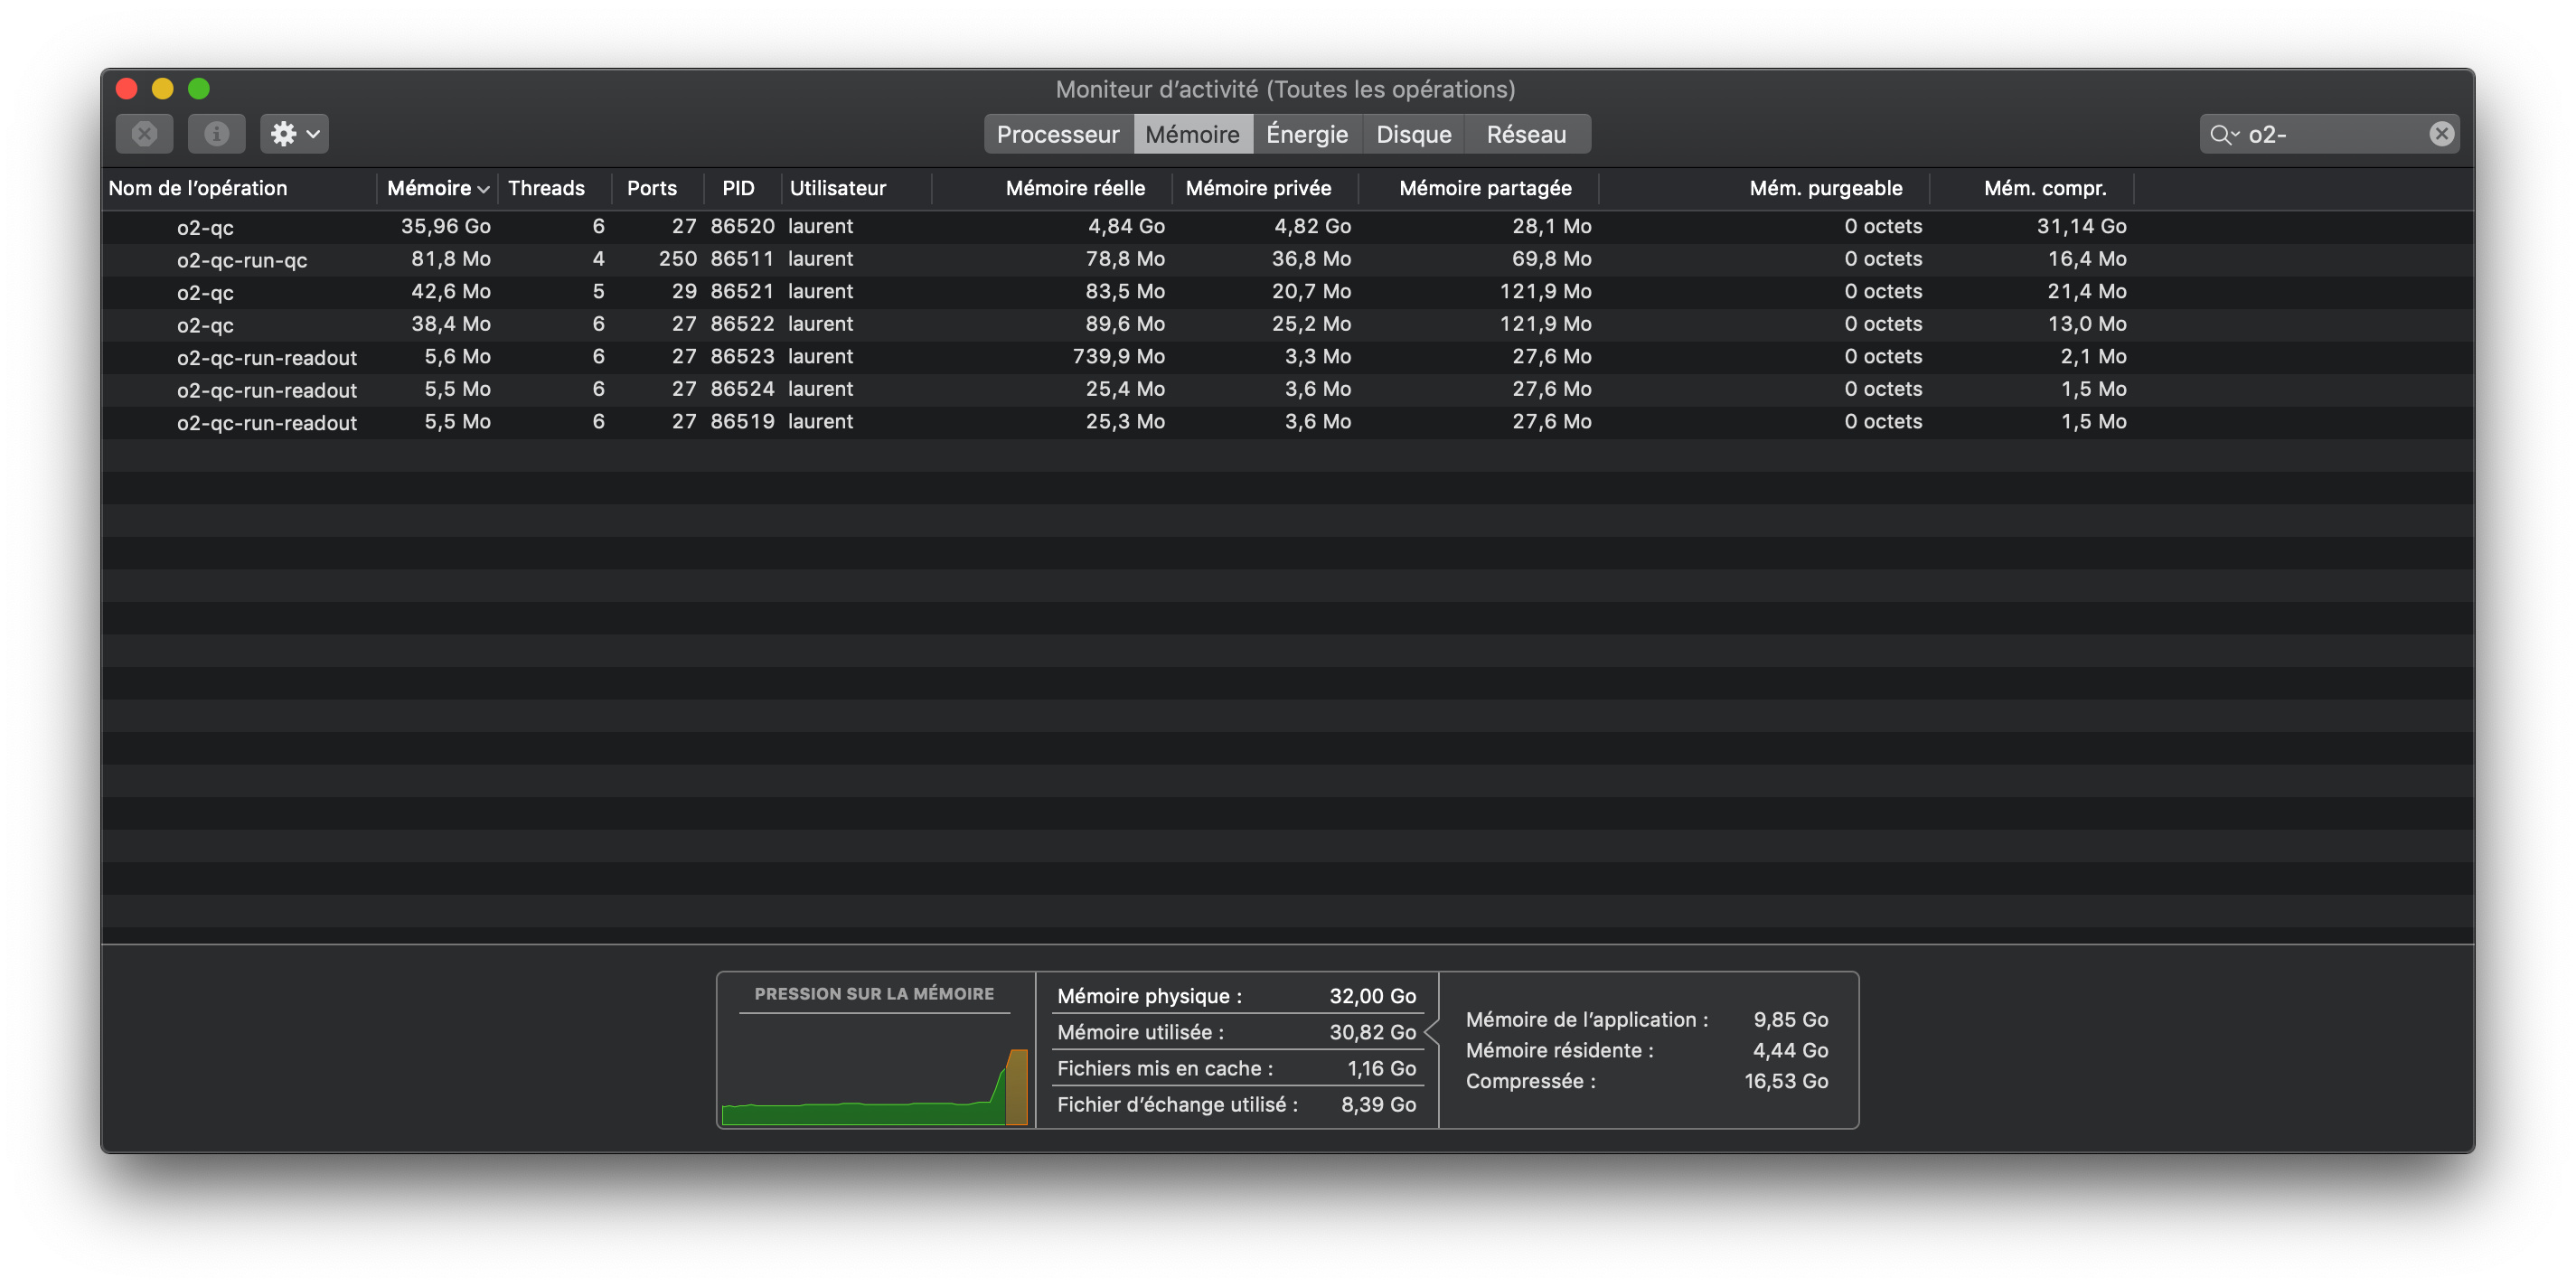
and it seems that the QC is not seeing any input data and so is basically doing nothing.
Most probably I’ve misconfigured something but I realize I have no idea on how to start debugging this : e.g. is it the readout which is not sending or the qc which is not receiving ?
I’ve also tried :
o2-qc-run-readout-for-data-dump
to remove (most of) the QC parts from the equation (at least this is my belief…) but here I’m not so sure what to expect (don’t see much activity in the GUI nor in the terminal log…)
Thanks,
PS: I’m trying this on a Mac, but at some point I’ve checked on a FLP-like machine with the same outcome.
The way I would start investigating the problem would be to look at the DPL debug gui. Do you have it ?
You should see where the data stops. Is it in the proxy ? if so the data is probably not being sent by the readout. If it is in the Dispatcher, then it is the data sampling that is not correctly configured.
Yes, I have the debug GUI (just needed Diego to tell me I had to double-click on a device to get its output ). Anyway, the log (either from terminal or from debug gui) says something like :
So it seems the readout-proxy is outputting some data to the dispatcher, but then the flow stops, meaning my dispatcher is not configured correctly, right ?
As for ideas for how to check situations like this, not really, apart from maybe detecting (and notifying the user) when (and where) the data is not flowing somewhere in the workflow (while it flows elsewhere) : not so sure however if there are legit cases for no data transfer within a workflow ?
both the readout.cfg and readout.json are clickable in the original post (destination is cernbox files, as apparently one can not attach cfg or json files to Discourse)
Not sure what might be the problem. The config files look good to me, logs - suspiciously little happening, the QC task does not publish even empty Monitor Objects.
I would like to exclude that something is silently going wrong inside the QC task. Could you please run that setup, but with the default readout.json? (the one in QualityControl/Framework/readout.json) Please check if data seems to move throughout the chain in the logs and if the object qc/DAQ/daqTask/payloadSize is being updated on https://qcg-test.cern.ch
Instructive test indeed. With o2-qc-run-readout | o2-qc-run-qc --config json://$QUALITYCONTROL_ROOT/etc/readout.json data is flowing and payloadSize histo is updated…
So I’ll have a closer look at the QC task then (I’m not the author of that one, just wanted to use it for some tests…)
Ok, the origin of the problem is now identified. The “QcTaskMCHPhysics” initialize method was never ending (trying to read from a non-existing file, without proper treatment of non-existence…). With this part fixed, the data is now flowing correctly and the memory is not growing.
While this solves my initial problem (again, thanks for the help in debugging this), but maybe there’s a lesson to be learned here ? I would assume the memory growing I observed was some consequence of the task being “non-responsive” in some way ? If that’s the case then such occurrences should probably be detected by the framework itself to avoid memory going overboard ?
I agree, there is something to be learned and probably some tool/mechanism to be developed to avoid this in the future.
When you say “framework”, did you mean DPL or QC ?
In general, I have the feeling that we lack a way to quickly identify where the data gets stuck/lost and/or which component is in which state. I was mislead by the message indicating that no data was going from the Dispatcher to the Task which made me blame the Dispatcher : [48577:Dispatcher]: [12:24:55][INFO] from_Dispatcher_to_QC-TASK-RUNNER-QcTaskMCHPhysics[0]: in: 0 (0 MB) out: 0 (0 MB). @eulisse any idea why the dispatcher would report 0 when it was actually pushing data ? I understand that the task was not processing the data, but I would expect the “other side” to report 0.
For systems running with the ECS and thus without a GUI, I had in mind to use the Monitoring package to know in which state each of the components is and representing it in grafana (+ the throughput probably). But I have to see with Adam how to do that. It would be installed with the FLP Suite probably and possible to set up on dev machines.
Which framework I had in mind is a good question
I would have said DPL as its the mother framework, but maybe it’s “too” general to be able to set clear cut expectations about data flows in all and every devices ?
On the QC side on the other hand, we probably can expect the QC tasks to “see” some data, as long as the dispatcher is seeing some ? So some sort of (lack of) correlation between the dispatcher and the qc tasks could be used to detect such cases ?
Just thinking out loud here…
Hmm, Dispatcher could have debug output where it would publish some statistics each x seconds, so we know if it is its fault, that it doesn’t send data. QC TaskRunner could receive them and react accordingly. Though I am skeptical about automatizing that. Visualizing the data flow would be a good first step.