I have been trying to test my checks on qcg-test, but every time I create a new histogram it is empty. If I look at old histograms its fine, its only new ones which are empty. I also checked with other people and e.g. @mlesch also experiences this problem, so the problem is probably not on my side.
In order to be able to investigate, I kindly ask you to always provide examples or instructions with how I can replicate this. For example, please provide the CCDB URL with the object that is not displayed anymore.
the one I am referencing is everything in qc/TPC/MO/Calibration_Generic/
if you look at the latest it is empty, but if you look at everything from June 15th and before they are all filled. I have not changed anything from the 15th to today.
QCG is a tool which allows users to visualize their data and it is not tempering with the content of the objects. I looked at the path you provided but as far as I can tell the plots are not empty. If you look closely in full page view, you will be able to see 2 blue line on both X and Y on the plots from 17th of June.
I also used the JSROOT Browser to confirm this, and it is the same behaviour there as well:
I would recommend you talk with QC owners to double check if something changed on their side as there is nothing to justify the issue on QCG side. @bvonhall or @pkonopka would you be able to advise on the topic?
I quickly jump into the conversation. Thanks a lot for your tests so far! However, the issue that @mahorst and I observe is not that the objects are empty/not filled but rather that we cannot display them at all on the qcg test page.
Consider for example the following object: http://ccdb-test.cern.ch:8080/browse/qc/TST/MO/ExampleTrendExtended/ExtendedTrending_meanX_of_histogram
When I look at this object on the qcg test page, I can see it up to time stamp “15/06/2022 17:59:36 (1655308776280)”. Everything later than this is not displayed. However, this is weird, as it did display this object on the 15/06/2022 on the qcg test webpage also later than 17:59:36. The qc versions of the objects did not change and are all set to 1.62.0.
I can replicate your issue and at the same time I can also replicate it with the ROOT browser. The JSROOT version that we use has not been changed. Thus, if you look on the right side of the table in the link you provided of CCDB, you will see 2 options under column “Replicas”
The first option is local repo(http), will allow you to download your object as a ROOT file. You can then, take this file and upload it on the official ROOT webpage ( Read a ROOT file ). Here you will see your object is plain white.
The second option is to use ROOT browser which will then open your object in the official ROOT browser installed on the CCDB machine.
I confirm in both CCDB and QCG, no dependency on ROOT was updated so the behaviour did not change.
I can only suspect that something changed in your objects, or the data that is being placed in those objects, classes being used, etc.
I am afraid I cannot provide any expertise to the CPP object generation code. For that I would still recommend Piotr’s or Barth’s help.
Thanks a lot for checking this! This is really weird as I used the same code before and after 6 p.m. on Wednesday and the visualization worked back then.
I looked a bit more at the differences of 2 versions of the object you provided and I can see there are some differences so the object is not the same.
First object which works (MID5:18d120fa8ee3fa4869ad970e18660b7a )
It has a size of 8192
Second object which does not work (MID5: 1f060fc56a9a4cb00a8981da192fb545)
It has a size of 4096
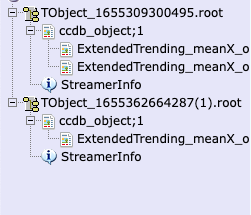
We can already see that is missing half of it. When attempting to open it with JSROOT browser, I can also see that the object which is plain white has only half of it (see screenshot below;)
Thus, the 2 objects are not the same. Maybe the code generating is failing somewhere silently and that is why the object is missing half of it?
both of the objects are TGraphErrors for trendings vs time. The latest version of the object that I can still display is a trending that has run over the time of 10 min (15/06/2022 17:59:36 (1655308776280)). The first object that is not displayed anymore (the one with time stamp 15/06/2022 18:07) only has run for 2 min and has much less data points. The size could thus be related to this. However, the underlying code which produced these TGraphErrors has been the same.
What is more puzzling to me is that I could display all the objects on Wednesday evening. Only today in the morning I noticed that I cannot view them anymore.
But I will do some additional checks on my side and run the task again. I will update you if there are any news.
I just run again the task (same version of the code as Wednesday evening) to produce the TGraphErrors mentioned above. Now the object is displayed properly. So everything seems to work, which of course leaves the puzzle what went wrong in the time since 15/06/2022 6 p.m. and sometime yesterday/today.