while using the QC trending framework, we discovered an interesting feature in the QCG webpage.
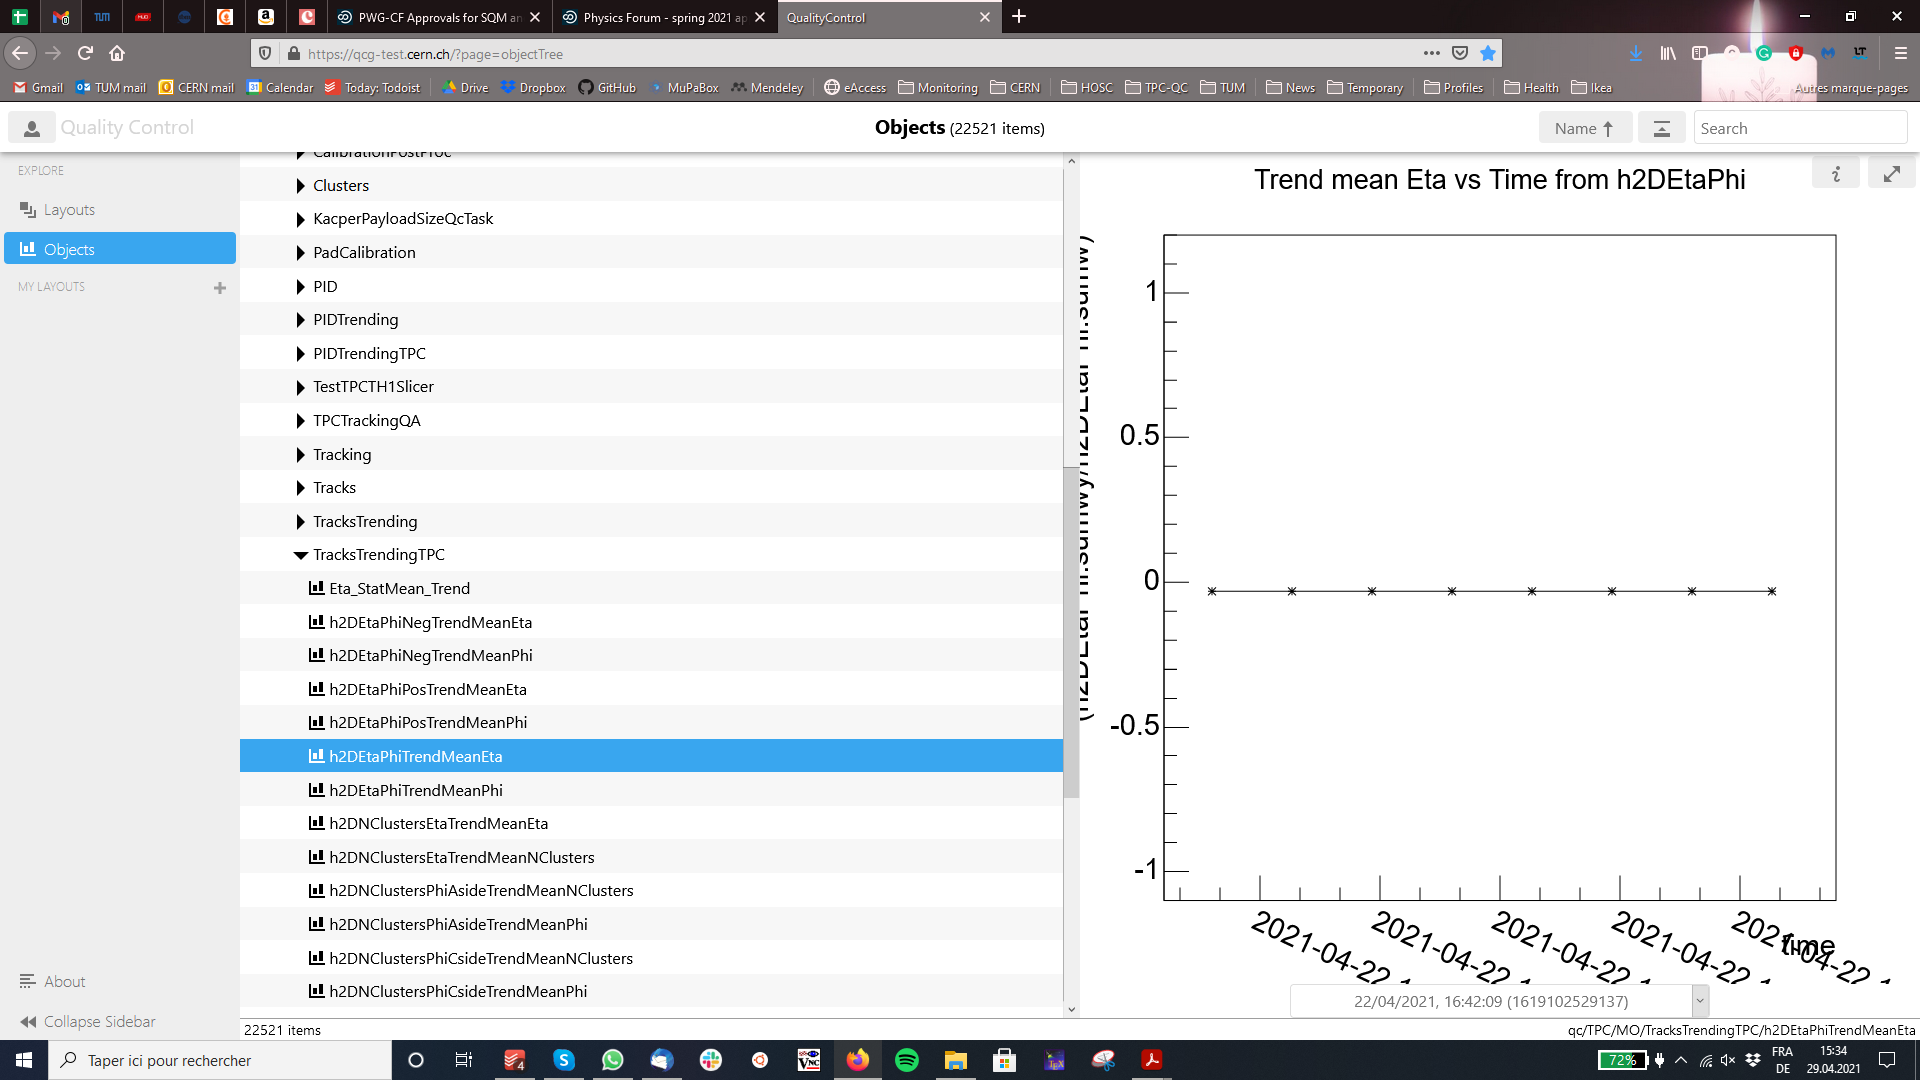
We wanted to check out some features of the trending framework and to do so, we trended the mean of a TH1 histogram over time. We always accessed the same histogram which does not change over time and as such, the mean over time is constant as expected.
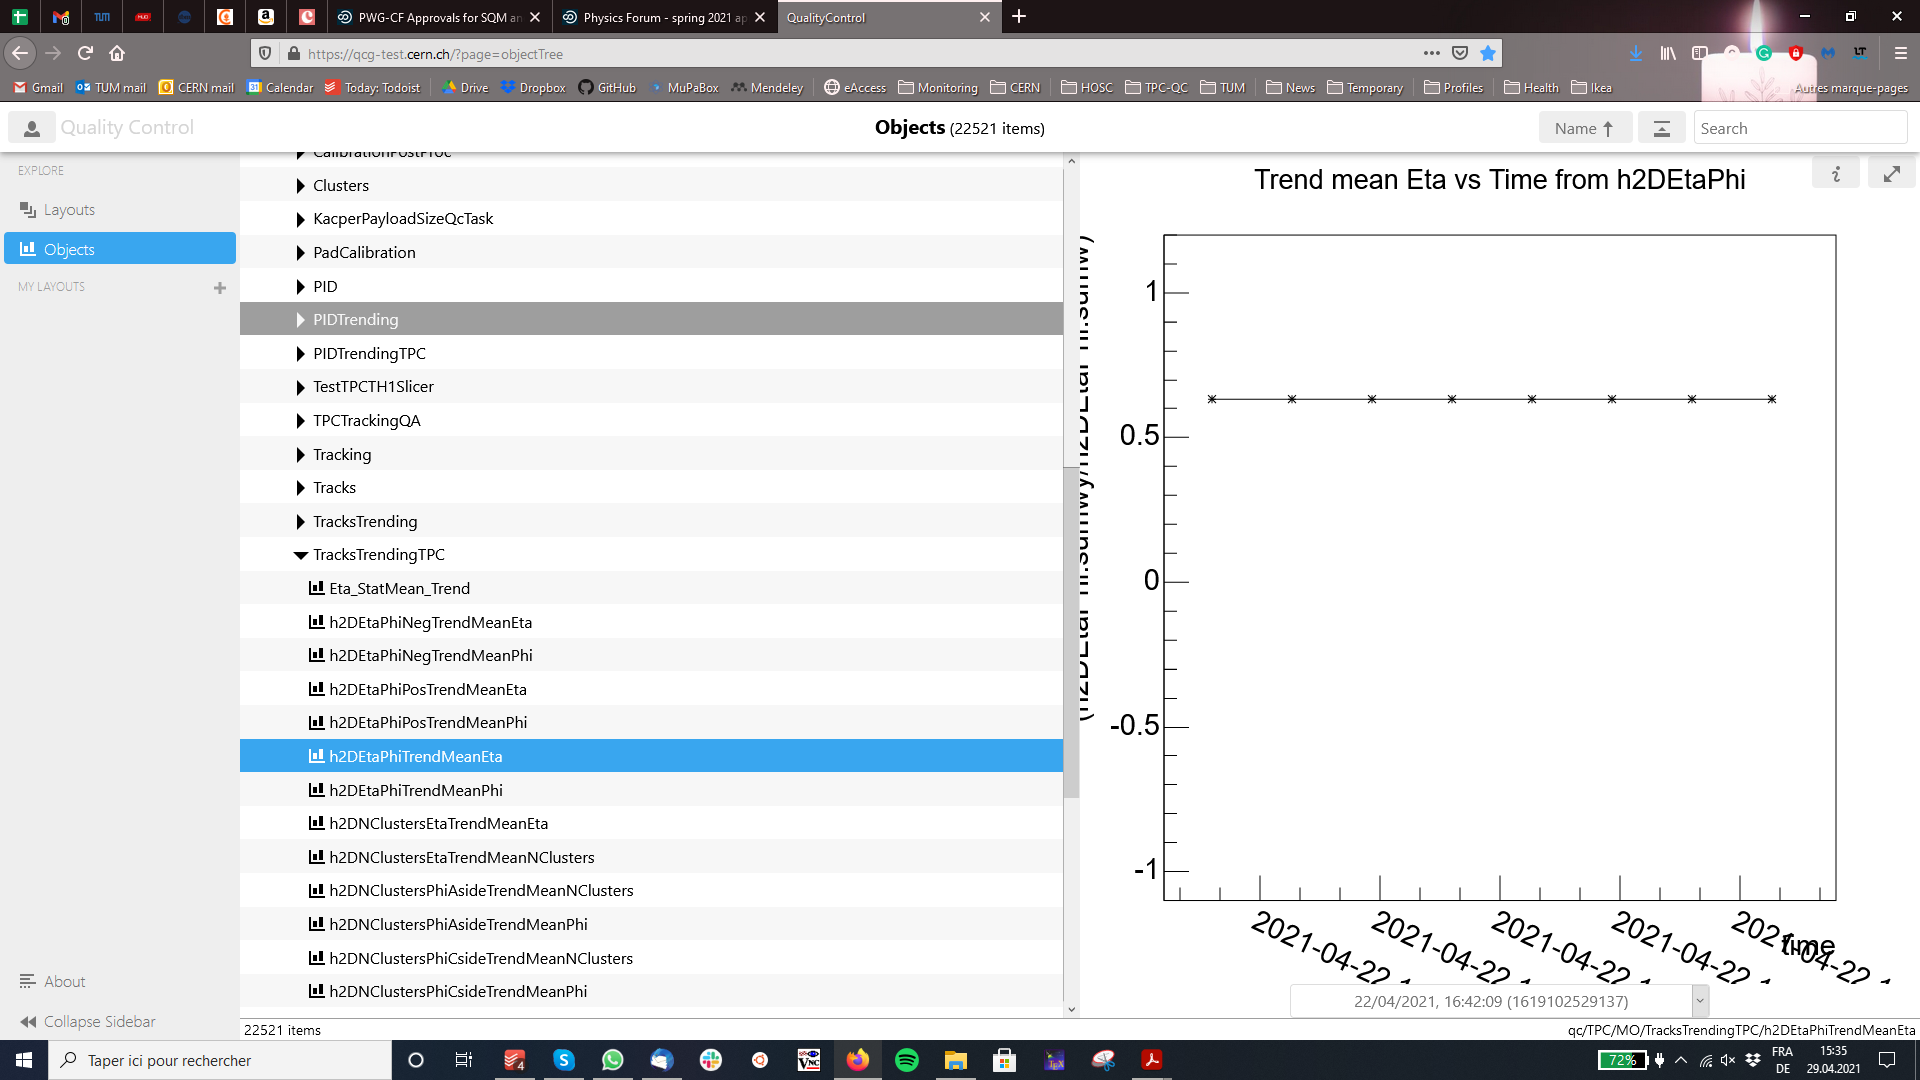
However, when we zoom in around the mean on the y-axis and unzoom afterwards, the value of the full line shifts either upwards or downwards. If we then zoom in and unzoom one or two times more, it happens that the points not only shift but disappear completely. Only when selecting the trending again by double clicking, everything is back in place. Therefore, it seems that this is some kind of visualisation problem.
As an example, you can try this with the trending TPC/MO/TracksTrendingTPC/Eta_StatMean_Trend
I am not sure I follow the problem here. In order to replicate the behaviour, it would help us a lot if you could provide some screenshots with the issue you are describing.
When we unzoom again with a right-click on the y-axis. The data are back to positive and at a higher value than initially. Zooming in and out again makes all data disappear.